
Using Prometheus, Grafana and Docker on a Raspberry Pi
 Our house has been experiencing intermittent internet issues. Our cable provider, Comcast, has come out a few times to take a look but they have not found the root cause yet.
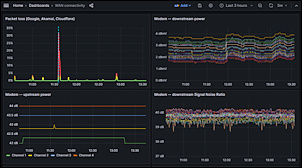
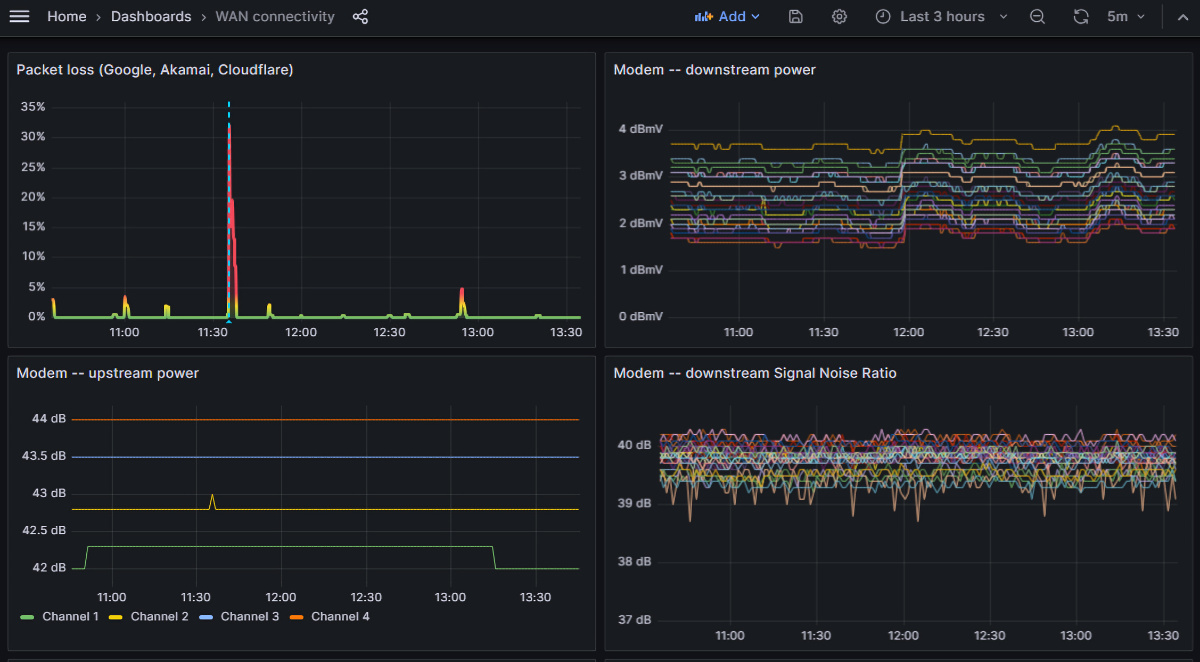
I spent some time creating a dashboard for myself, so I could track the problem better. I installed Docker on a Raspberry Pi, and installed Prometheus, InfluxDB and Grafana plus custom scrapers for my Motorola modem. All this came out quite nicely.
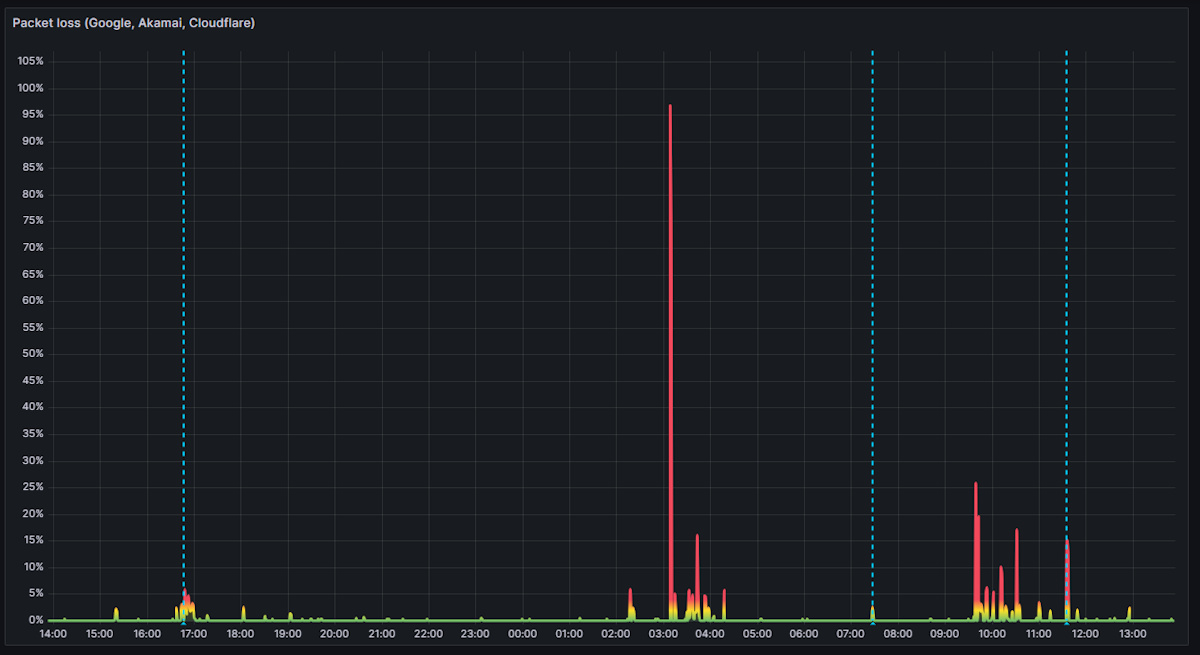
The first chart shows packet loss -- I run a ping test every few seconds against a couple of internet targets. It's very clear that this connection is not clean.
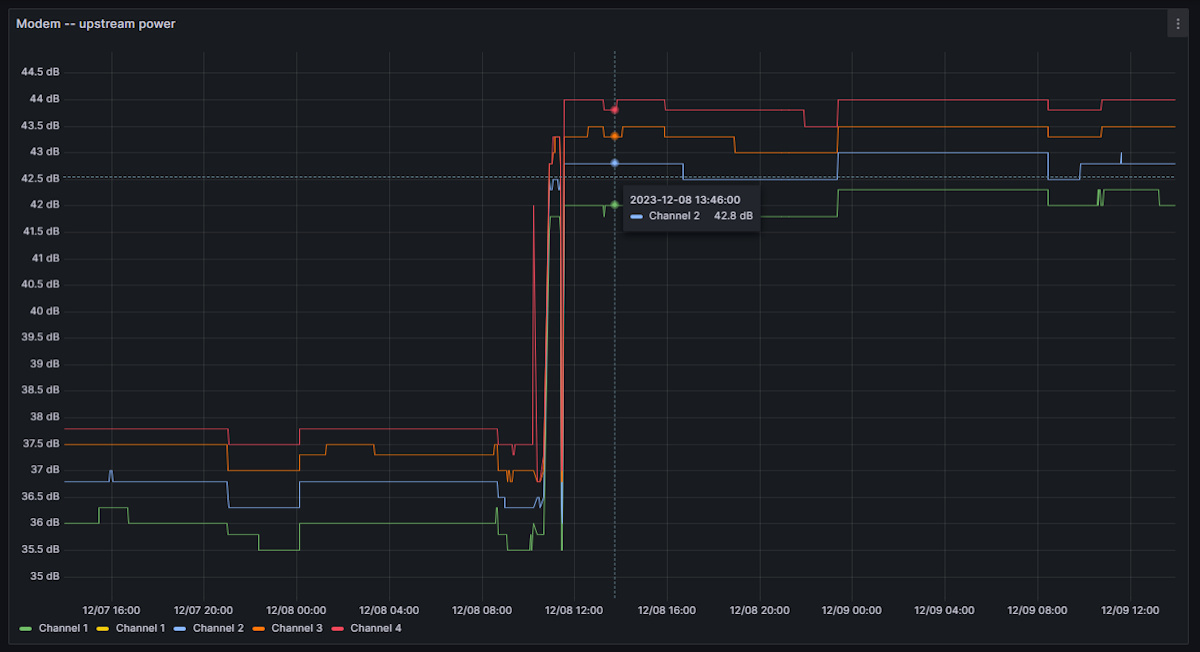
The other charts show details from the modem. For example, when the Comcast engineer worked on my cables yesterday, it resulted in much higher Upstream Power -- which we thought might have resolved it, but sadly didn't.
- Log in to post comments
